Friction happens. Reach users before they leave.
Your analytics show 81 users abandoned at 'Connect Stripe'. We show you 33 waited 45 seconds and let you message them before they're gone.
Free tier. No credit card. Upgrade anytime.
Friction Your Analytics Can't See.
API Failures
156 API failures on account creation form because users consistently leave 'Company Name' field blank
Geographic Latency
Users in Europe waited 18 seconds for their graph to load while users in the US saw it in 2 seconds
Scale Issues
Accounts with 1M+ records experienced 10x slower queries than new users
Monitor. Prioritize. Engage.
Monitor for Friction
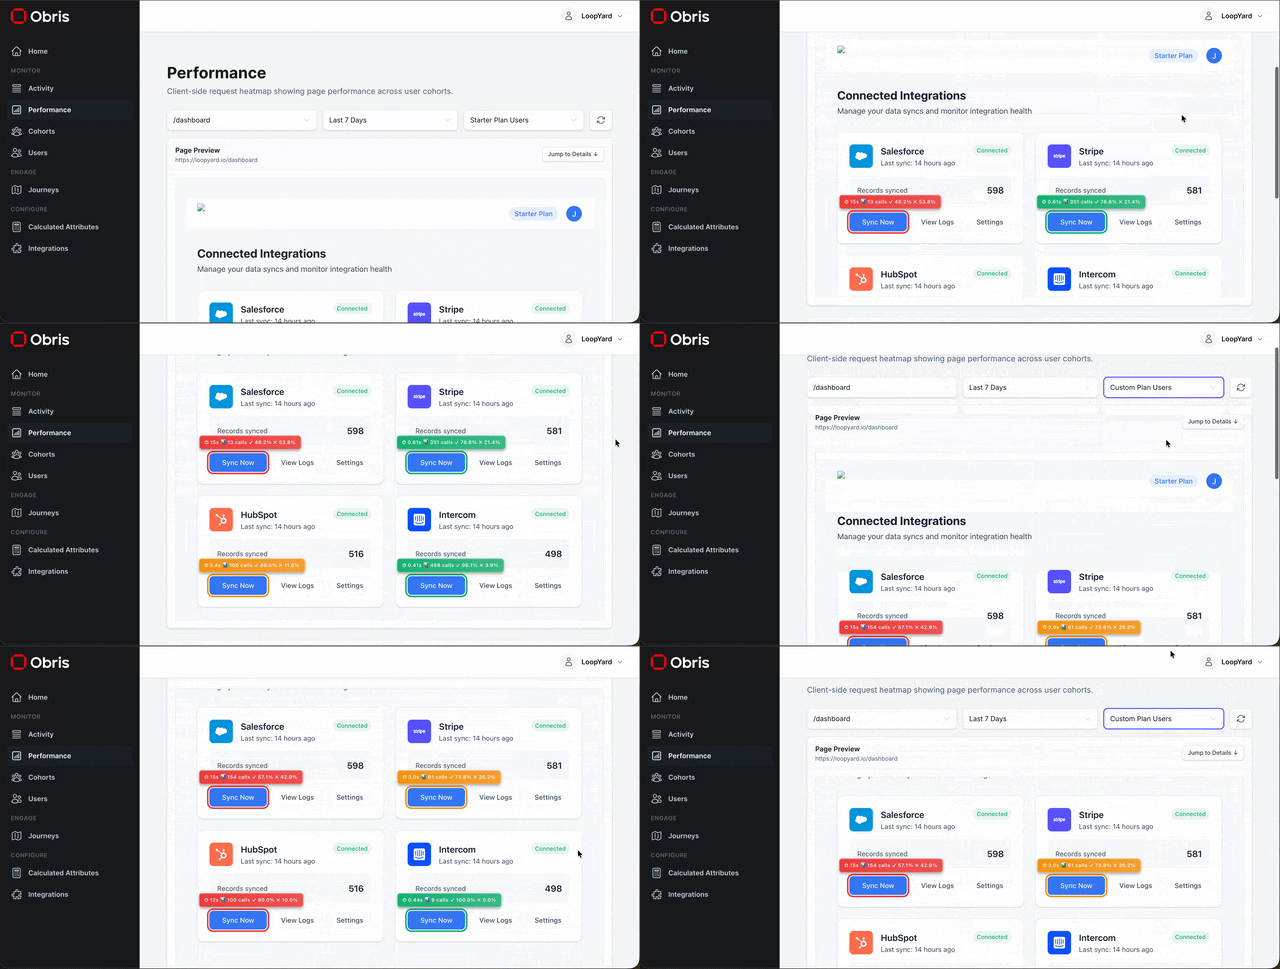
Track user-experienced performance across every button, form, and interaction in your UI
Prioritize by Impact
See which issues affect the most users and understand the scope before allocating engineering resources
Engage with Affected Users
Message affected users as they hit issues or after you've shipped a fix.

Friction Varies by Cohort.
Monitor how enterprise customers, new regions, or other key cohorts actually experience your product.
0.8s
Avg Latency
96%
Success Rate
Stripe and Intercom syncing perfectly. Zero complaints.
15s+
Avg Latency
44%
Failure Rate
Salesforce integration broken. Enterprise customers churning.

Catch issues before they impact revenue.
Fills the Gap in Your Analytics Stack.
Connect to the tools you already use.


Ready to Reach Users Before They Leave?
One script tag. Start reaching users today.
Free tier. No credit card. Upgrade anytime.